Reports and statistics
Output per technician for any period, share calculated on money actually received, and branch statistics.

At the end of the month a service has to answer two questions: how much did we earn, and how much do we owe each person. ServiceCenterSoft answers both in ten seconds — with the technician report and the branch statistics.
Three questions that usually have no answer
Ask yourself right now, without looking anything up:
- How many repairs were handed over this month, and for how much?
- How much of that was actually received, and how much is still outstanding?
- How much is owed to each technician — not "roughly", but to the penny?
If the answer to any of the three begins with "let me work that out", that is exactly where the money leaks. Not on the big things, but on what nobody ever added up.
The technician report, for any period
Pick a period and you get a table: who, how many repairs, for what amount, how much of it was paid, what their rate is and what they are owed. A totals row runs along the bottom.
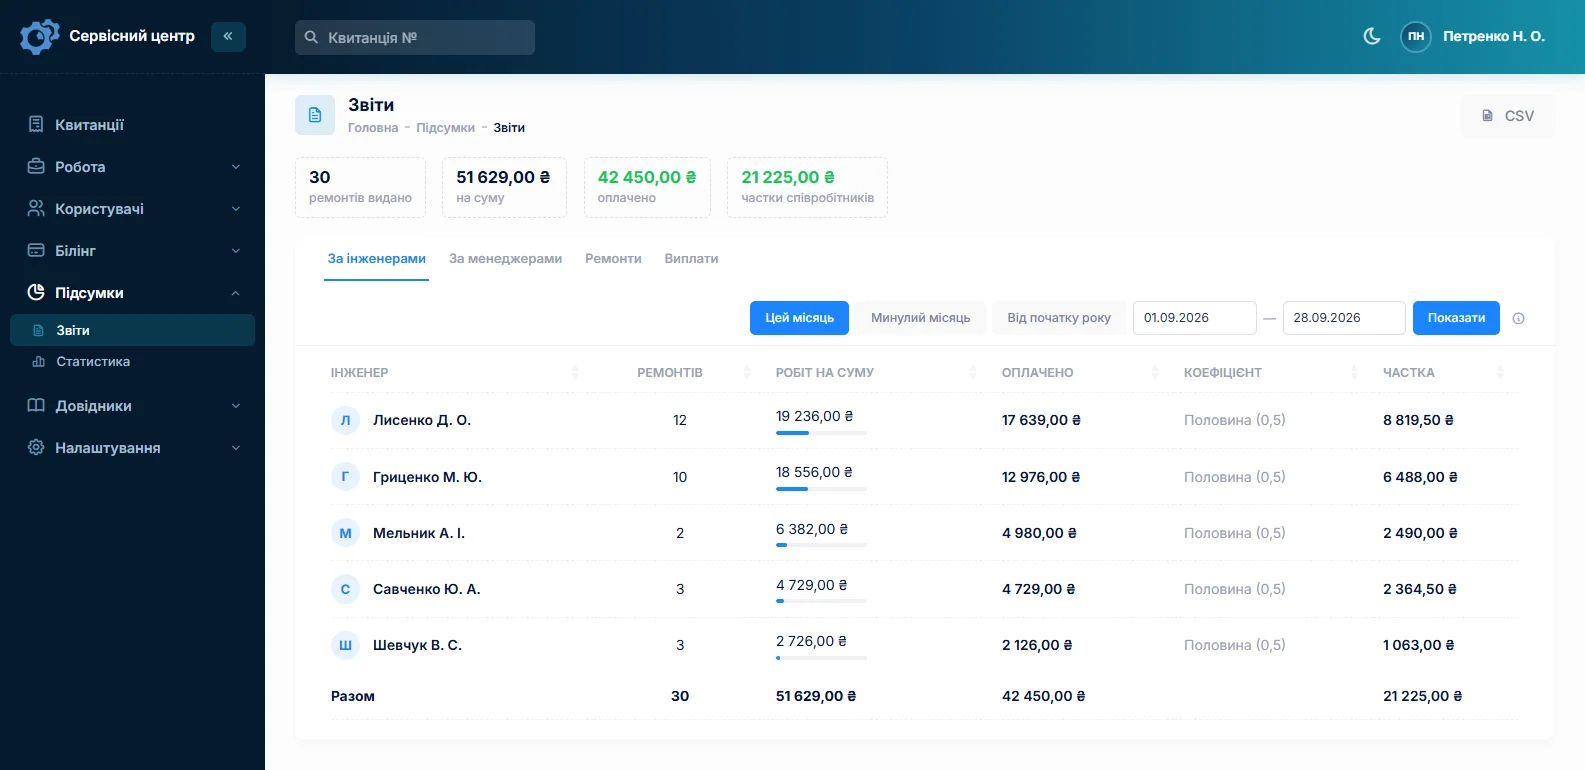
The default period runs from the first of the month to today, so opening the section already shows you the current month. The dates can be changed to anything.
It counts by handover date — and that matters
Only handed over repairs enter the report. Not taken in, not ready, not "nearly finished" — the ones that went back to the customer.
This is deliberate, and it is the main convention worth understanding. A repair finished on the 31st and collected on the 1st lands in the following month. That feels unfair, but the alternative is worse: counting by ready date pulls in devices that have been sitting on the shelf for a fortnight, and the month looks "profitable" on money that is not in the till.
The share is calculated on money received, not billed
That is the second thing that matters. The "share" column is paid × rate, not amount × rate.
The difference is that a technician does not earn a percentage of money the service never saw. If a device went out on credit and the customer pays next week, the share appears when the payment does. This removes the most common argument in services that pay on percentage.
Technicians and managers are counted separately
A switch at the top of the report changes who is being counted: the people who repaired, or the people who handled the customer. The same job appears in both reports — rightly so: two people did it, and two people get paid.
One person can have different rates in different roles. A technician who covers the front desk on Saturdays earns on their own repairs at the technician rate, and on the customers they handled at the manager rate. The rates themselves live in a reference list with their own names, so the report shows not a bare number but "Senior technician (0.35)".
Everyone sees only themselves
A colleague's pay is not an employee's business. Without a separate permission a person opens the same section and sees only their own rows: what they did and what they are owed. The full table is for the owner and whoever they grant that right to (access rights).
That defuses a share of the conflicts before they start.
Branch statistics
The second section answers not "who gets paid" but "how is it going". Per branch, per period: how many devices were taken in, how many handed out, how many are in progress right now, what was handed out for and how much of that was paid.
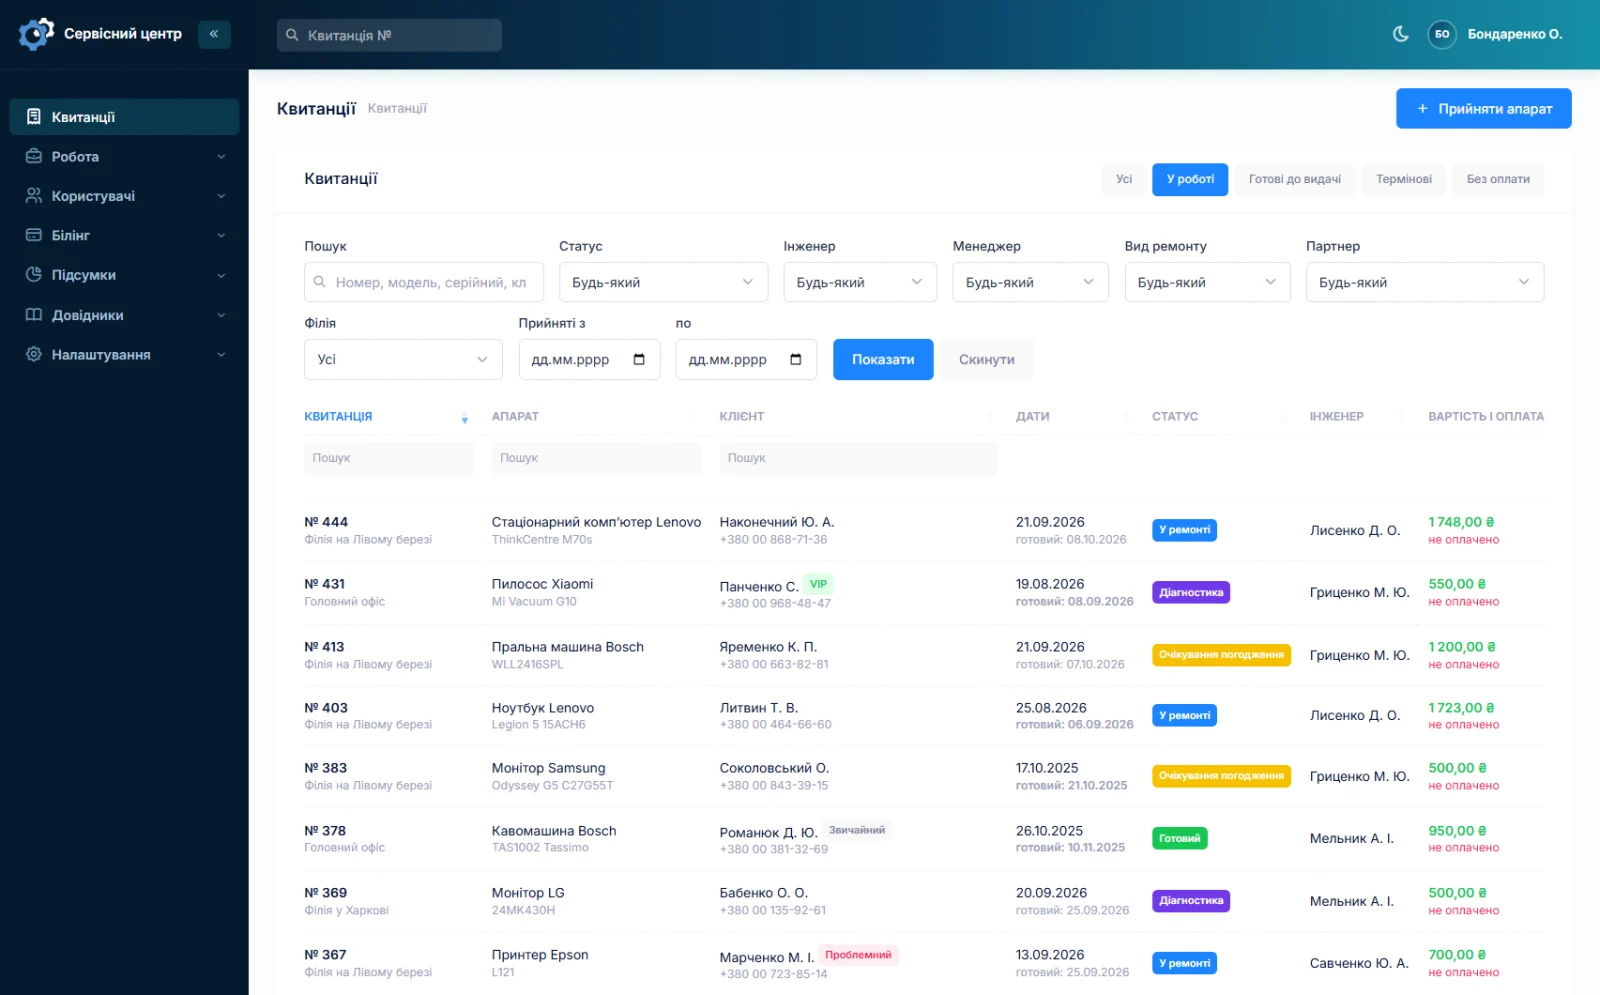
The period switches with one click: month, quarter, year to date, or your own. The "in progress" column is not per period but right now: how many devices are sitting open at each location.
It is the comparison of taken in, handed out and in progress that shows whether a branch is coping. If it takes in more than it gives back, the queue is growing — and that shows as a number rather than a feeling.
The action log: who did what in the software
Alongside the reports there is an action log, separate from the history of an individual job. It records, in order, what staff did: created a job, changed a status, printed a certificate, booked a part in, emailed a customer, logged in. Every entry has an author, a time and an IP address.
The report answers "how much", the log answers "who". Those are different questions and should not be confused: in the report a technician with a zero total can look idle, while the log shows they spent the week handling other people's handovers.
The log gets read rarely, usually twice: when something has gone missing, and when somebody says "I didn't do that". Both times it turns out to be the only place where what actually happened is written down.
What the reports do not do
Honestly, so that you do not go looking:
- No export to Excel or CSV. The table is read on screen and printed from the browser.
- No charts or graphs. Numbers in a table only.
- No profit calculation. The software knows what customers paid, but not your rent, taxes and wages — so it does not compute "net profit" and does not pretend to.
- No side-by-side period comparison and no reports by repair type or brand.
If one of those is exactly what you need, write to us: a report built around your way of working is custom work.
What you get
- Output per technician for any period, ready for payroll.
- A share calculated on money actually received rather than billed.
- Separate accounting for those who repair and those who handle the customer.
- Different rates for the same person in different roles.
- A report in which an employee sees only themselves.
- The branch picture: taken in, handed out, in progress, amounts.
What it costs
Reports and statistics are part of the subscription — there is nothing extra to pay.
Monthly
Paid every month, cancel whenever you like.
Yearly
Cheaper than paying monthly. Invoice or card payment.
Custom work
Changes tailored to the way you work — hourly, by agreement.
You can see them on live data in the demo. Related pages: repair workflow and branches and access rights.
Frequently asked questions
Which date does the report count by?
By handover date: only repairs that went back to the customer are included. Finished on the 31st, collected on the 1st — that is next month. This is deliberate: counting by ready date would book money into a month while it is not yet in the till.
Is the share based on the full amount or on what was paid?
On what was paid: the share is "paid × rate". A technician does not earn a percentage of money the service never received. If a device went out on credit, the share appears when the payment does. This removes the most common argument under percentage pay.
Can one person have different rates?
Yes. The rate is set separately for the technician role and the manager role, so a technician covering the front desk on Saturday earns one rate on their own repairs and another on the customers they handled. Rates live in a reference list with their own names.
Will a technician see colleagues' pay?
Not unless you grant a separate permission. Without it a person opens the same section and sees only their own rows. The full table is for the owner and anyone they allow.
Can I export a report to Excel?
No. There is no Excel or CSV export, and no charts either. The table is read on screen and printed from the browser. If export is what you need, that is custom work — write to us.
Does the software calculate the service's profit?
No. It knows what customers paid, but not your rent, taxes and wages — so it does not compute net profit and does not pretend to. What it does give: revenue on handed-over repairs, how much of it was paid, and what is owed to the technicians.
See also
Several branches and access rights
Each location with its own address, stock and statistics; permissions as checkboxes rather than fixed roles.
Read moreCRM for a repair service centre
A customer database with the history of every repair, labels, companies and partners, a ready-for-collection email and a customer portal. Without a sales pipeline, which a workshop does not need.
Read moreCertificate of completed repair work
What a repair completion certificate should contain, when you really need one, and how to have it build itself from the work log instead of being written from memory at the end.
Read moreSee how it works
The demo is open — go in and try it. Ask us anything by email, Telegram or the form on this site.